Haven't been on much this off-season but something that I've been meaning to do is come back to the numbers that I posted on this topic before and during the 2015 season.
If you dont like or care about stats, feel free to press the "back" button now.
Last September, I posted this thread on the topic of Russell Wilson and passes over the middle. At the time, there was a lot of discussion about Wilson being unable (or limited in his ability to) find receivers in the middle of the field. In particular, the short middle.
With that in mind, I decided to look for any statistical indicators that could help to answer the question. After Graham went down after week 11 (I think?), I posted this and now I'm simply going back to see how the numbers turned out.
This thread will be a quick summary of what we saw in 2015 compared to previous seasons and I'll leave it to any interested parties to decide what they think it does or does not say.
Before I get to the stats, two things:
1. I made a mistake in my initial queries by not calculating league average for "% of Ttl Att" using QBs with 100+ attempts (or more) during the season. It had a pretty dramatic impact on the number. While I am not going to go back and correct the old thread, I felt that the difference was enough to warrant calling it out here.
2. I am not a math guy so feel free to correct any mistakes on my part but don't jump my ass about math. Here's a google doc w/ some of the info below.
That said, here's how the numbers worked out:
Top 10 rated passers (to the short middle) in 2015:

The big take away for me here is that Russell's volume of short middle passes jumped pretty significantly as a percentage of his total attempts (12.9% from 2012-2014 to 17.39% in 2015). For me, it's an indicator that play design and scheme are a real factor that led to some of the criticism (unless someone can point to film that suggests Russell is seeing people that he did not from 2012-2014).
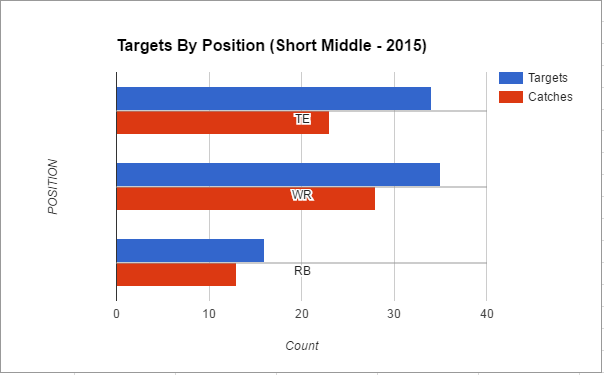
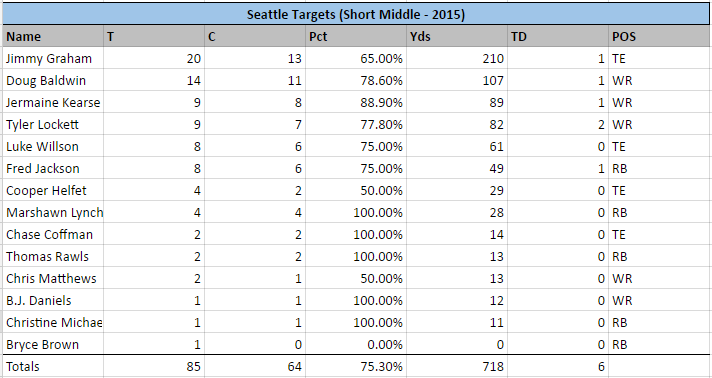
Wilson's Targets by Position and by player:


Graham was far and away the target of most passes over the middle when he was healthy. When he went down, volume remained about the same but the ball got spread around and production took a real hit (by that, I mean over the short middle, not the offense in general). See below.
Weeks 1-11 (short middle passing):

Weeks 12-15 (short middle passing):

Seems pretty straight forward. Big target with large catching radius and athleticism goes down, production goes down with them. It is interesting to me that volume didn't go down after Jimmy's injury and (to me) indicates that despite the media jumping on the whole "the offense took off because Jimmy wasn't around" has no real basis in fact. If he'd been part of the offense during those last 5 games, I think our offense would have been even more productive in this area and overall.
Just one copy/paste from my first post on the topic but another consideration is that the interception rate over the middle of the field (short and deep) are significantly higher than other areas.
Interception rates by area of the field 2012-2014:
While I didn't have time, I would be interested to look into any correlation between QB ratio of passes over the middle and interception percentage on a QB by QB basis.
Ok, that's it.
* Stats are from http://www.pro-football-reference.com
If you dont like or care about stats, feel free to press the "back" button now.
Last September, I posted this thread on the topic of Russell Wilson and passes over the middle. At the time, there was a lot of discussion about Wilson being unable (or limited in his ability to) find receivers in the middle of the field. In particular, the short middle.
With that in mind, I decided to look for any statistical indicators that could help to answer the question. After Graham went down after week 11 (I think?), I posted this and now I'm simply going back to see how the numbers turned out.
This thread will be a quick summary of what we saw in 2015 compared to previous seasons and I'll leave it to any interested parties to decide what they think it does or does not say.
Before I get to the stats, two things:
1. I made a mistake in my initial queries by not calculating league average for "% of Ttl Att" using QBs with 100+ attempts (or more) during the season. It had a pretty dramatic impact on the number. While I am not going to go back and correct the old thread, I felt that the difference was enough to warrant calling it out here.
2. I am not a math guy so feel free to correct any mistakes on my part but don't jump my ass about math. Here's a google doc w/ some of the info below.
That said, here's how the numbers worked out:
Top 10 rated passers (to the short middle) in 2015:

The big take away for me here is that Russell's volume of short middle passes jumped pretty significantly as a percentage of his total attempts (12.9% from 2012-2014 to 17.39% in 2015). For me, it's an indicator that play design and scheme are a real factor that led to some of the criticism (unless someone can point to film that suggests Russell is seeing people that he did not from 2012-2014).
Wilson's Targets by Position and by player:


Graham was far and away the target of most passes over the middle when he was healthy. When he went down, volume remained about the same but the ball got spread around and production took a real hit (by that, I mean over the short middle, not the offense in general). See below.
Weeks 1-11 (short middle passing):

Weeks 12-15 (short middle passing):

Seems pretty straight forward. Big target with large catching radius and athleticism goes down, production goes down with them. It is interesting to me that volume didn't go down after Jimmy's injury and (to me) indicates that despite the media jumping on the whole "the offense took off because Jimmy wasn't around" has no real basis in fact. If he'd been part of the offense during those last 5 games, I think our offense would have been even more productive in this area and overall.
Just one copy/paste from my first post on the topic but another consideration is that the interception rate over the middle of the field (short and deep) are significantly higher than other areas.
Interception rates by area of the field 2012-2014:
| Location | Comp | Att | Comp% | Int (Int %) |
|---|---|---|---|---|
| Short Left | 10826 | 15945 | 67.9% | 263 (01.6) |
| Short Middle | 7076 | 10291 | 68.8% | 249 (02.4) |
| Short Right | 11899 | 17743 | 67.1% | 289 (01.6) |
| Deep Left | 1361 | 3699 | 36.8% | 191 (05.1) |
| Deep Middle | 1152 | 2380 | 48.4% | 196 (08.2) |
| Deep Right | 1548 | 4051 | 38.2% | 217 (05.3) |
While I didn't have time, I would be interested to look into any correlation between QB ratio of passes over the middle and interception percentage on a QB by QB basis.
Ok, that's it.
* Stats are from http://www.pro-football-reference.com
