Hyak
Active member
The whole debate about the defense carrying the offense over the years and subsequent friction big or small got me curious as to how the data shook up in whether the units did their parts in a game.
The NFL average for points scored/allowed over the past 6 seasons is 22.75. I did a simple scoring system for this - the offense got a point for games with points > 22.75 (23 +) and the defense got a point for games with points allowed < 22.75 (22 and below) and accounted for scores from Special Teams or Defensive scores. I know there are some flaws (starting field position for one).
Example - In 2012, the Seahawks beat the Cowboys 27-7. One score, however, was on a blocked punt so the offense only put up 20 points hence they did not get a "1" for above the NFL average. The 2014 NFCC is another case as 7 points came on the Ryan fake FG pass.

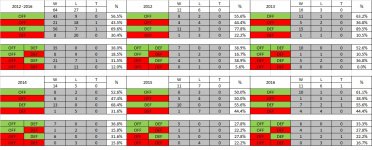
In the graph, Green is good and Red is bad. The first set looks at how the units did and the corresponding W/L results. The second set is the combination. Green for both offense and defense represents a clean game (offense 23+, defense 22 or less).
Trend wise, you can see the regular dominance of the defense in terms of Green games start to decline some from almost always in 2012 (78%) / 2013 (90%) to 55.6% in 2016. Offensively, 2013 was the high mark (63%) followed by 2016 ironically (61%).
In looking at the combos, it gets interesting.
For years, the defense could carry the team to victory even if the offense put up less that 23 points. From 2012-2015, they were 20-5 when this scenario happened. Not in 2016, when they went 1-2-1. Likewise, the offense rarely bailed out a below average defensive performance going 4-8 from 2012-2015. In 2016, however, the Hawks were 4-1 when this happened. The irony is that frustrations have boiled over when one can argue that the 2016 team was significantly better at carrying the team when needed than prior recent teams, even the SB ones.
It also interesting to see the games where both units are above average and when they are not. The 2013 SB season had 10 green games and 0 red ones. Double green games in other years ranged from 7 in 2012/2014, 6 in 2016, and 5 in 2015. In the double red games, they had only 1 in 2012/2013 and have had 10 in the last 3 years (3 in 2014, 4 in 2015, and 3 in 2016).
The NFL average for points scored/allowed over the past 6 seasons is 22.75. I did a simple scoring system for this - the offense got a point for games with points > 22.75 (23 +) and the defense got a point for games with points allowed < 22.75 (22 and below) and accounted for scores from Special Teams or Defensive scores. I know there are some flaws (starting field position for one).
Example - In 2012, the Seahawks beat the Cowboys 27-7. One score, however, was on a blocked punt so the offense only put up 20 points hence they did not get a "1" for above the NFL average. The 2014 NFCC is another case as 7 points came on the Ryan fake FG pass.

In the graph, Green is good and Red is bad. The first set looks at how the units did and the corresponding W/L results. The second set is the combination. Green for both offense and defense represents a clean game (offense 23+, defense 22 or less).
Trend wise, you can see the regular dominance of the defense in terms of Green games start to decline some from almost always in 2012 (78%) / 2013 (90%) to 55.6% in 2016. Offensively, 2013 was the high mark (63%) followed by 2016 ironically (61%).
In looking at the combos, it gets interesting.
For years, the defense could carry the team to victory even if the offense put up less that 23 points. From 2012-2015, they were 20-5 when this scenario happened. Not in 2016, when they went 1-2-1. Likewise, the offense rarely bailed out a below average defensive performance going 4-8 from 2012-2015. In 2016, however, the Hawks were 4-1 when this happened. The irony is that frustrations have boiled over when one can argue that the 2016 team was significantly better at carrying the team when needed than prior recent teams, even the SB ones.
It also interesting to see the games where both units are above average and when they are not. The 2013 SB season had 10 green games and 0 red ones. Double green games in other years ranged from 7 in 2012/2014, 6 in 2016, and 5 in 2015. In the double red games, they had only 1 in 2012/2013 and have had 10 in the last 3 years (3 in 2014, 4 in 2015, and 3 in 2016).
