Oh, cool. Didn't see this, and thanks for posting it!
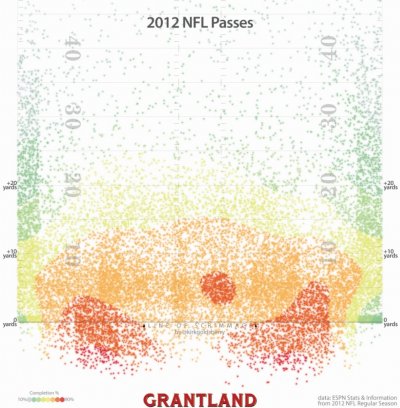
Most interesting thing (IMO) is in comparing the graph titled Common NFL Passing Locations with the following NFL Completion Percentage one.
With the former beyond 10 yards from the LOS you get a "U" shape for where passes are going based on percentages of passes thrown, whereas with the latter it's up the middle of the field (filling in the "U") where the higher percentage of passes are being completed.
Three ways to explain that:
1) NFL offenses are irrationally targeting the sidelines whereas they should be looking to hit the middle of the field more.
2) NFL offenses are behaving rationally and while there's a higher completion % up the middle of the field, there's also a higher interception rate (would be cool to see the completion % overlayed with where interceptions happen)
3) NFL offenses are behaving rationally and while there's a higher completion % up the middle of the field, the gains are on average longer within the 10-20 yard range and beyond 20 yards.
I'd guess it's a combination of #1 and #2; QBs are rightly somewhat risk averse and trying to minimize the number of bodies in the vicinity of throws, but might tip too far in this regard too.
I was pretty harsh on Grantland when it first launched, but think I was wrong, as it has really contributed to a lot of sports and non-sports discussions in a meaningful way (stuff like this and the breaking down of offensive strategies, as well as the investment in long form journalism). I think Bill Simmons is the classic emperor with no clothes, but sheesh, all credit where its due for the people he has been able to bring in and what Grantland has ended up accomplishing.


